Understanding Araali Assessment
In this section, we’ll walk you through the key security insights uncovered by Araali assessment. Much of the information can also be obtained as a yaml report, but the CVE annotation is available only on Araali UI.
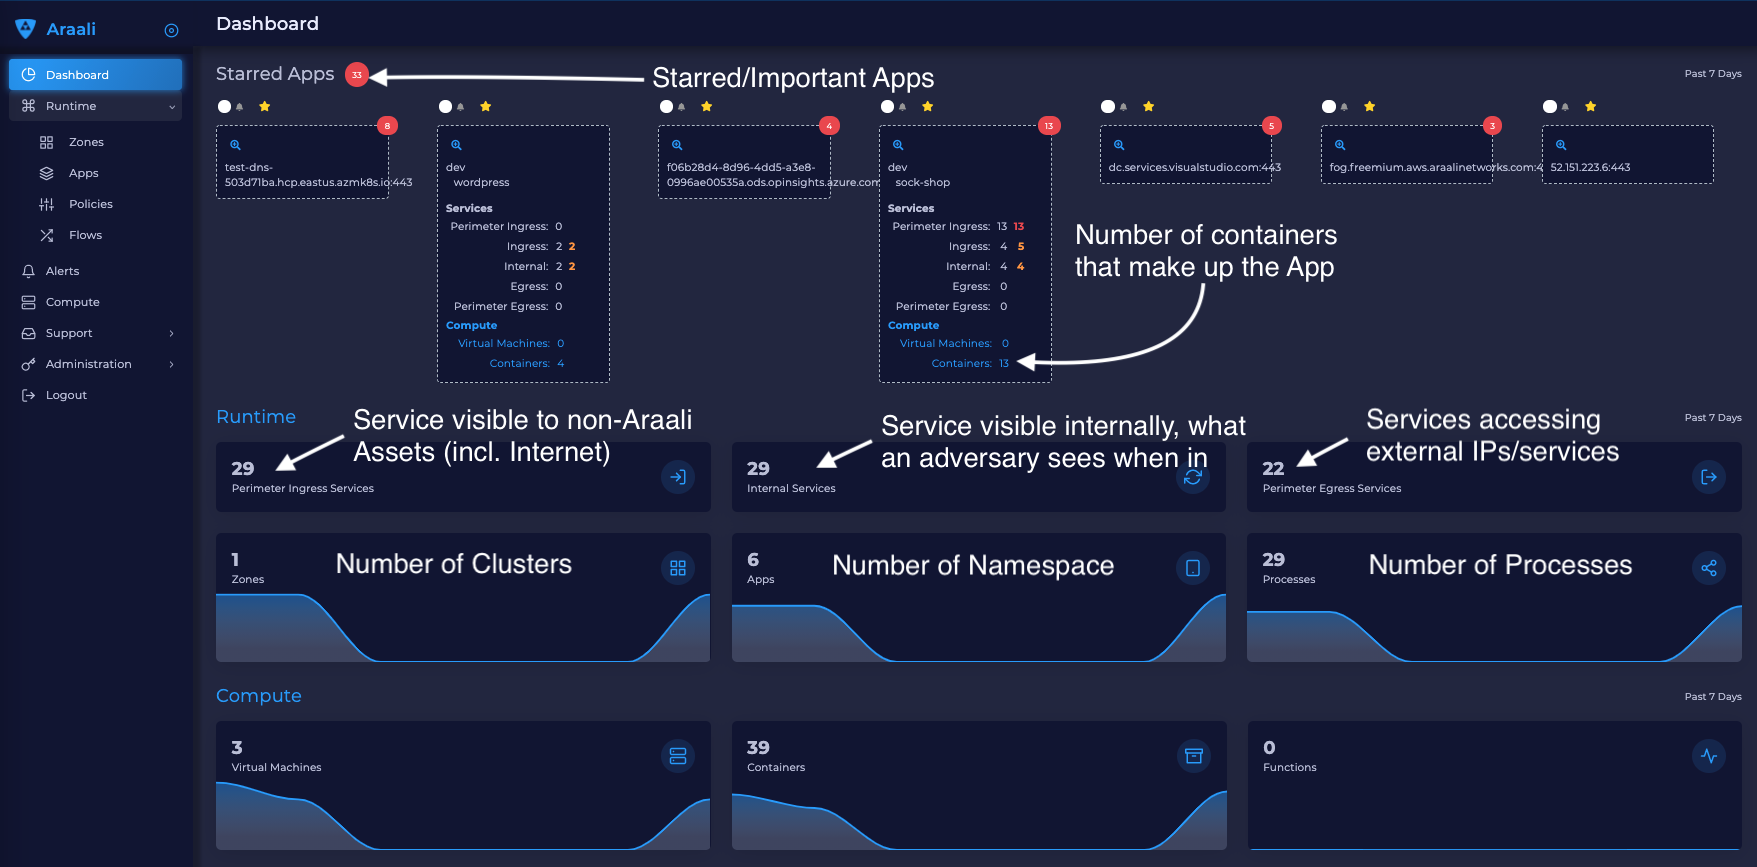
Overall count of services in your environment categorized as - publicly accessible, internal only, and in use external services
Important services / datastores (DBs and DBaaS) that you might want to protect with zero-trust
Test for important services being accessible by intruders?
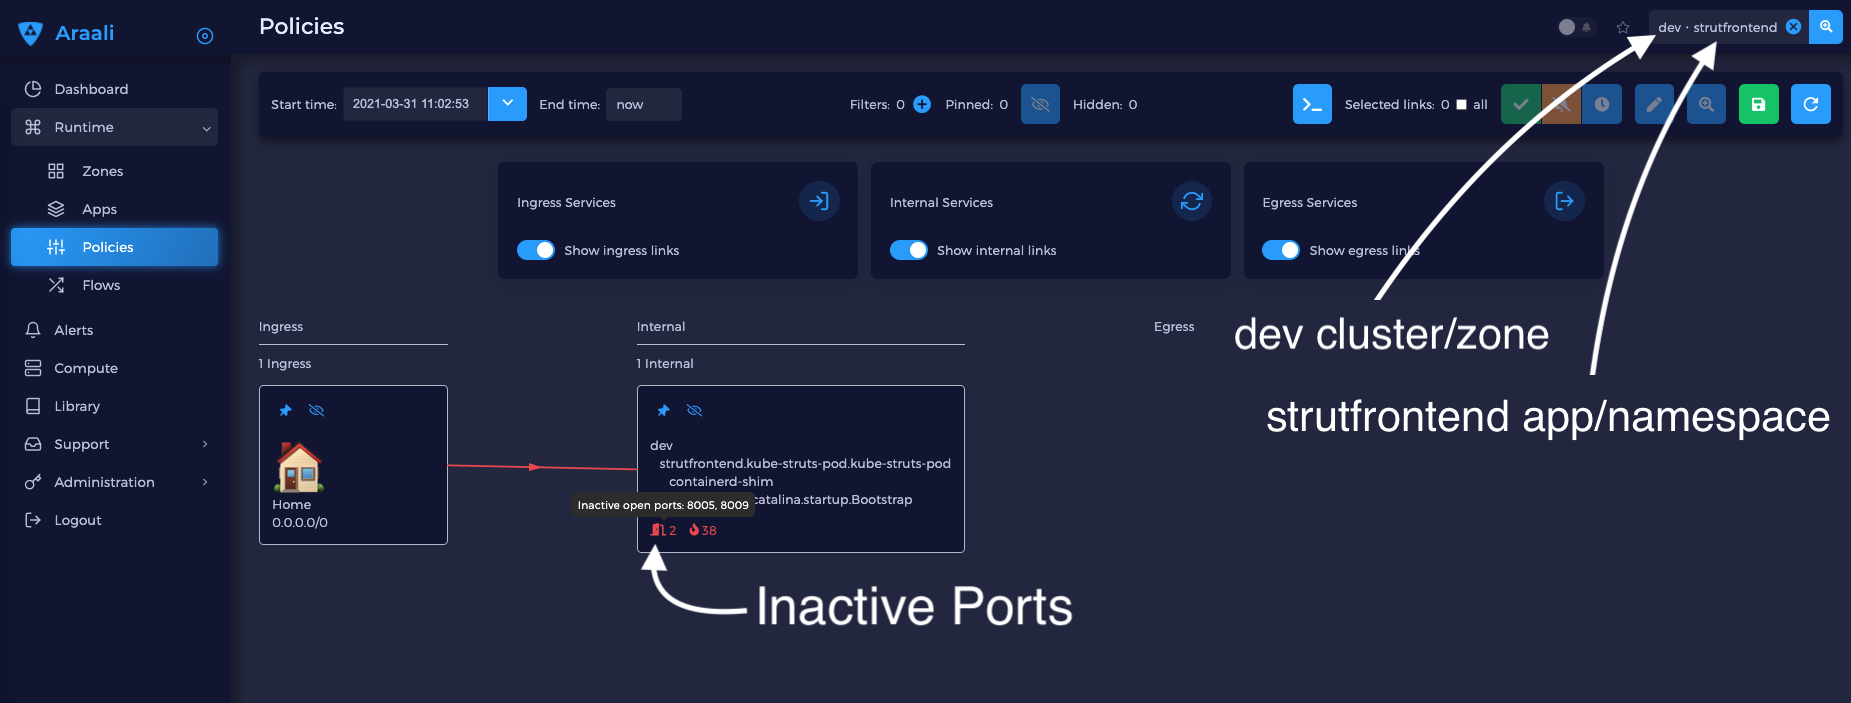
Inactive listen ports found in the environment
Report of vulnerable VMs and Containers (UI only)
How can you use this information:
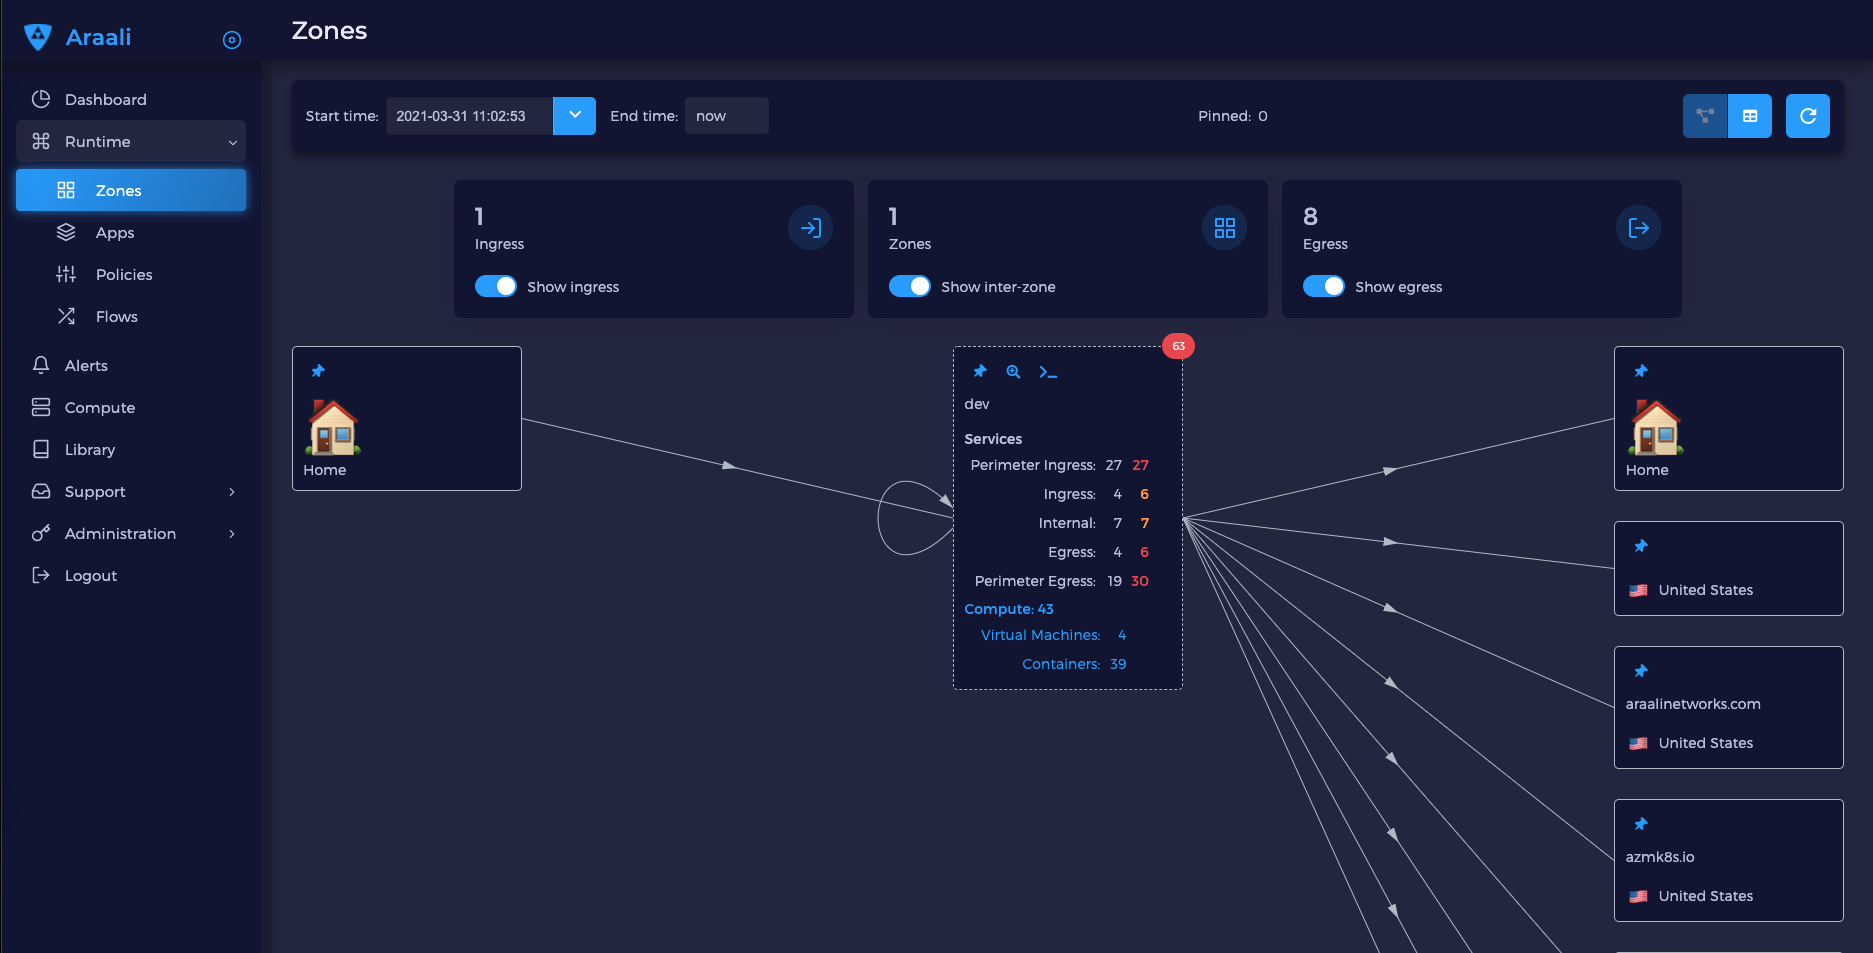
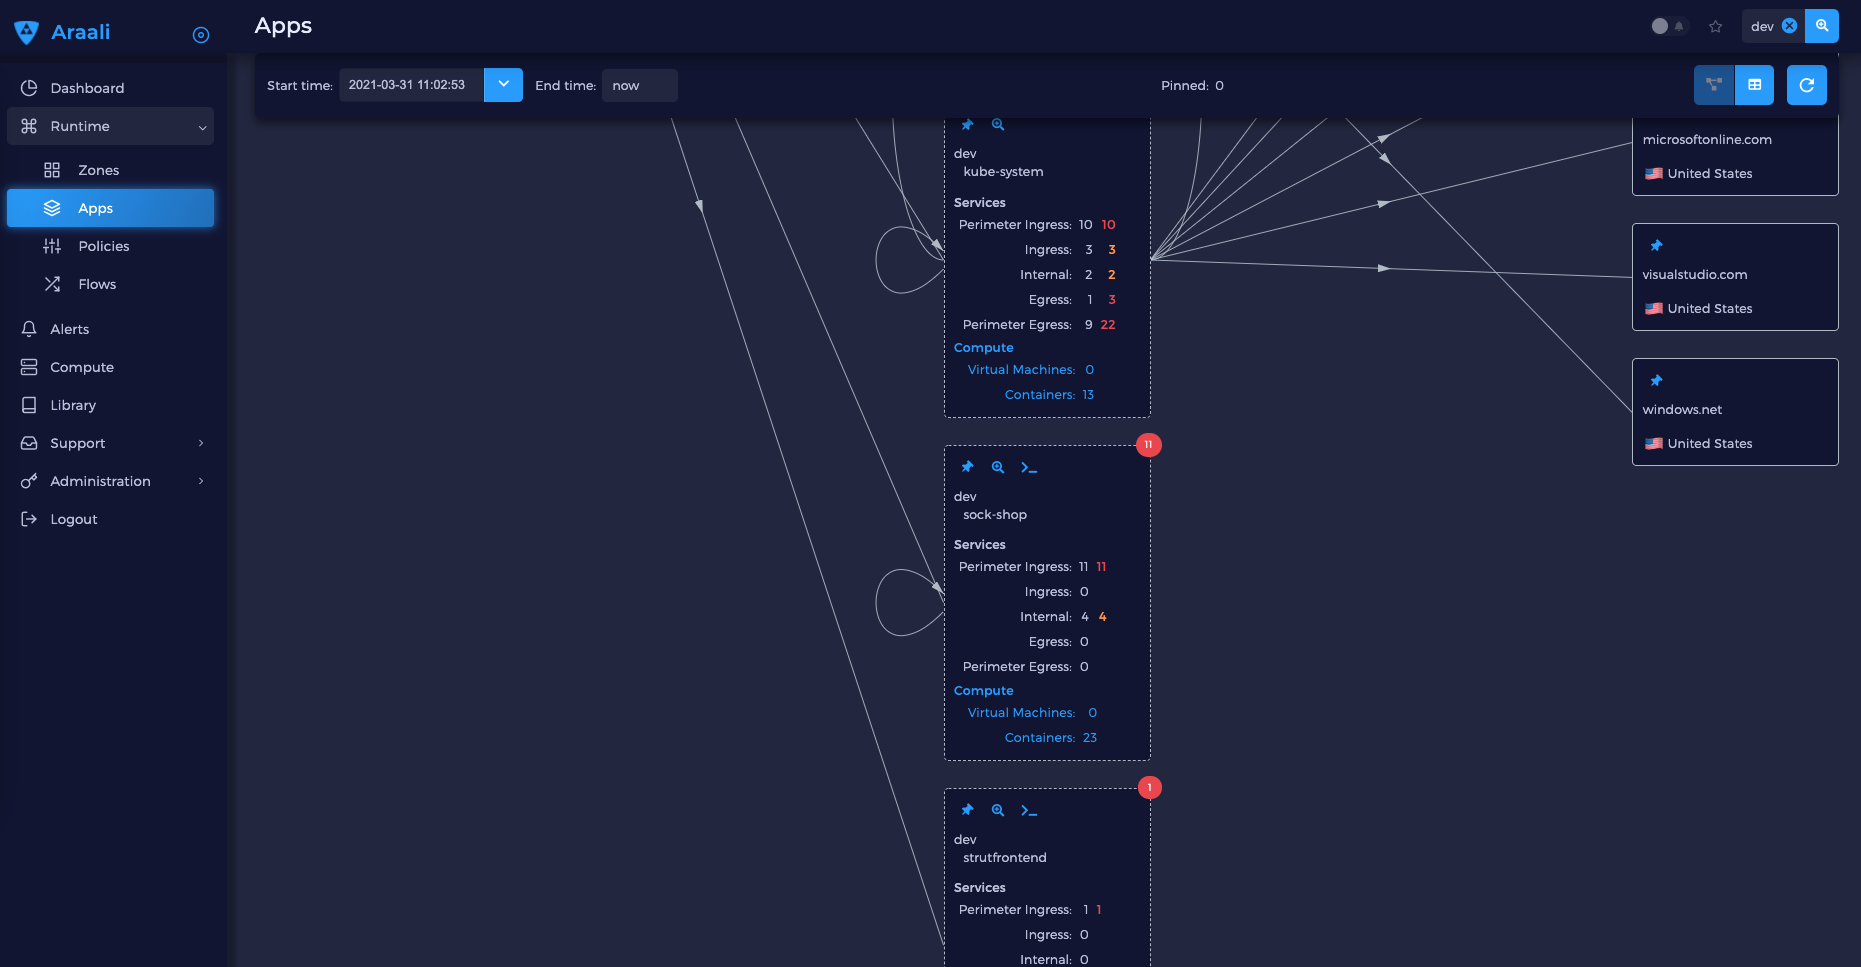
First and foremost, it produces a comprehensive, layered diagram of your environment and shows all the active apps and services.
This information helps you understand if you have any security misconfiguration in your environment; for example, your DB might be accidentally exposed to the world or accessible by intruders within your environment (lack of access controls).
Similarly, intruders might have access to your credential stores and in particular the metadata service, which holds keys to access cloud resources (CapitalOne Breach, 2019).
Also, it allows you to monitor your software supply chain - we call it monitoring your monitors.
Finally, you can visualize the flow of data between applications in your environment, annotated by any unpatched vulnerabilities, to help identify risk and prioritize potential remediation efforts.
Yaml output
You can generate the sample report using:
./araalictl assessment -report
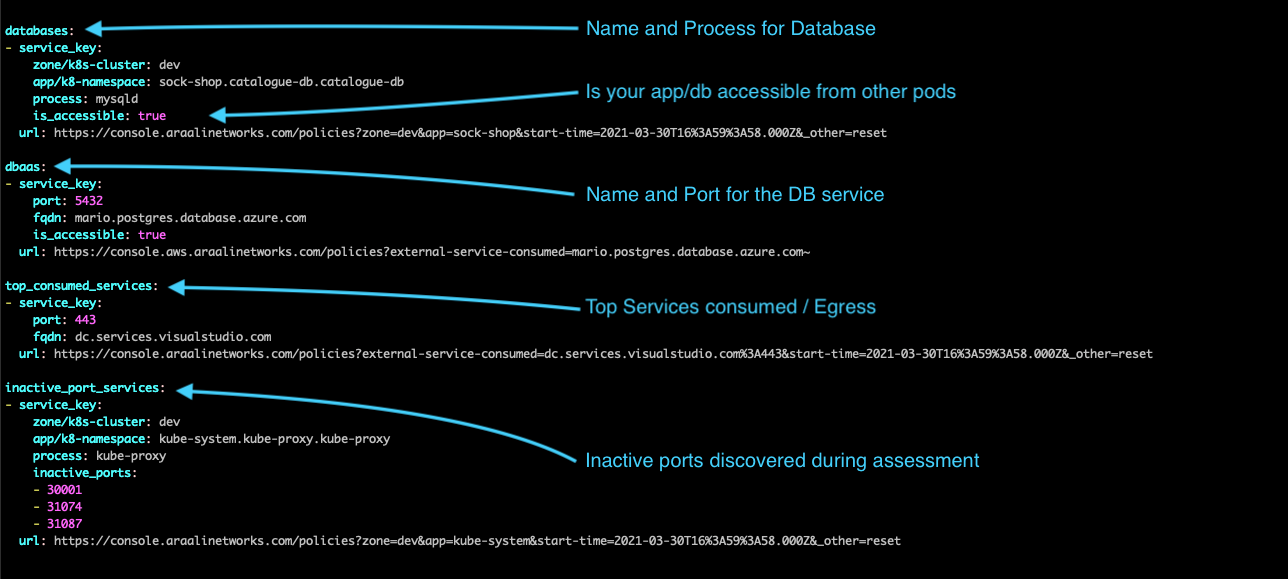
The report has many sections that are laid out in the diagrams below.
The top part of the report is the summary for the cluster.
Number of zones (or kubernetes clusters) = 1
Number of apps (or kubernetes namespaces) = 6
Number of internal services (not publicly visible) = 24
Number of external services consumed = 27
Number of services provided (publicly exposed) = 29

Database in your stack are listed under “databases” or “dbaas,” if you are running the database as a service. Depending on the database or dbaas you can see the name of the process or port and also if the database is accessible from an outside pod. If your db has unnecessary exposure, you will see the flag is_accessible as true.
Top consumed services are a list of external services/egress going out of your environment.
Inactive port services are services that have open ports that are not being used during the assessment. We encourage you to verify and close these ports if not in use.
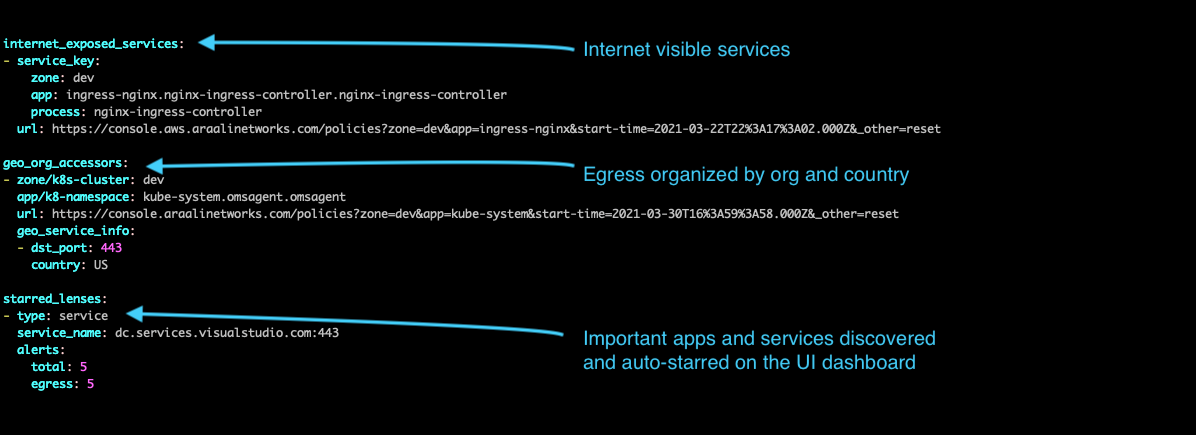
Internet exposed services are your services that are world visible or exposed on the internet. Any misconfiguration that leads to internet exposure will show up here.
Geo org accessors are services that access external/3rd party services organized by organization name and country.
Starred Lens is a list of important services and apps - your apps running Databases or services that have a high number of connections. They are auto-discovered and starred and will also show up on your Dashboard page.
